West Coast Regional Council Improve their environmental data
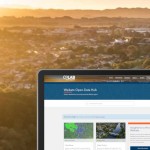
We teamed up with West Coast Regional Council to redesign their environmental data dashboards, delivering a user-friendly interface for their website. Learn more about this project...
Added 2 years ago
Case Study: West Coast Regional Council Environmental Data Dashboard
We worked with West Coast Regional Council to redesign their environmental data dashboards with a focus on creating a streamlined, user-friendly interface for the public. Given that these dashboards are among the most popular pages on council websites, creating a simple and intuitive customer experience was crucial.
- Overview Dashboard
- Rainfall Dashboard
- River level and Flow Dashboard
- Air Quality and Climate Dashboard
- Marine Dashboard

WebShed designed and developed intuitive environmental data dashboards for WCRC, providing real-time access to rainfall, river levels, marine conditions, and air quality data - empowering informed decision-making and effective public communication. Having already worked on a similar interface for Hawke's Bay Regional Council, we brought that experience to the table, ensuring the dashboard would function seamlessly.
The stand-out features:
The new dashboards offer a range of exciting features to enhance the user experience:
- Environmental Data in Real-Time
Instant access to rainfall, river levels, marine conditions, and air quality data for informed decision-making by both council and user. - Custom Viewing Options
Allowed users to view data in various formats including interactive charts and tables, with the flexibility to filter by custom date ranges for more detailed insights. - Backend Access for Site Management
The ability to easily turn on/off sites for outages and to override where necessary. - Colour-Coded Rainfall Intensity
Distinguishable rainfall intensity levels with colour changes for clear interpretation to track weather events. - Alert Levels for River Levels
Immediate alerts when river levels reach critical thresholds, keeping the community informed of potential issues. - Reporting Options
Simplified reporting tools for easy analysis of rainfall, river levels, marine conditions, and air quality.
The benefits:
The new, easy-to-use dashboards not only improved the public's experience - resulting in a reduction in enquiries - but also gave staff on the ground better visibility into current conditions. The inclusion of reporting tools provides for a clearer, long-term picture of environmental data, enhancing decision-making processes for both staff and the public.
Interested in learning more or seeing a demo?
If you're a council looking to enhance how you present environmental data and improve public engagement, we can help you to create user-friendly, tailored environmental data dashboards. Let’s talk about how we can help you achieve the same success as West Coast Regional Council.

Paying for storage you don’t need?

Closed Easter and ANZAC

Waikato and Bay of Plenty councils open data more accessible than ever

Move beyond spreadsheets: A smarter way to manage your data

Plastoil's new website improves user experience and content accessibility
